Content has been updated as of Oct. 13, 2021
Valves good enough to be used in motion control applications have Bode plots in their specifications. The problem for engineers is interpreting what the Bode plots are trying to convey.
Basic Bode plots graph two lines of data: the magnitude or gain and phase. Both lines are plotted as a function of frequency. The frequency scale is logarithmic and may be in radians per second or Hertz (Hz). Most Bode plots for valves use a logarithmic frequency in Hertz.
The magnitude or gain scale is measured in decibels (db) and is like the frequency response of audio equipment. Decibels are calculated using a logarithmic formula but are plotted on a linear scale.
The basic formula is:The amplitude and phase of the valve spool is compared to the amplitude and phase of the valve’s input. A signal generator sends the input sine wave to the valve in range of different frequencies. As the frequencies increase, the valve spool’s sinewave amplitude decreases and phase delay (measured in degrees) increases.
The spool’s amplitude gets compared to a reference amplitude taken at 0 Hz. The phase delay between input signal and the spool response is also measured as a function of frequency.
How is spool position measured when it is inside the valve? Servo solenoid valves provide spool position voltage feedback that makes comparison easy.
What are the oil pressures during the test? At higher pressures, flow forces affect the spool’s motion.
The answers to these questions are not in the valve manufacturers online data files This makes comparing valves based on manufacturer’s specifications an inexact estimation.
Valve manufacturers like to give valves ratings of 30Hz. Typically, they rate valves at the point the gain drops to −3db, or sometimes at a phase delay of 90 deg.
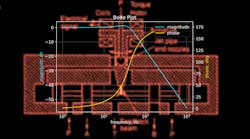
This Bode plot shows the magnitude and phase for a simulated valve with a natural frequency of 40 Hz and a damping factor of 0.5. Magnitude drops to −3 db. and phase delay increases to about 90 at near 50 Hz.
Notice that the magnitude increases a little above 0 (unity gain) at about 15 to 30 Hz. This is due to the lower damping factor. The ‘bump’ in the gain decrease as the damping factor increases.
Bode plots for valves show phase differently from how textbooks do it. Valve Bode plots show phase delay at 0 in the lower left and increasing to the right. Most textbooks, however, show phase delay starting at 0 at the top left and decreasing to the right.
There are two difficulties with the way valve manufacturers rate valves. The −3-db. rating should not be used for estimating the valve’s true response. The −3db rating at 50 Hz means a valve spool that should move ±1 mm only moves ±0.707 mm. Assuming the valve is linear, that results in almost a 30% speed decrease from the desired value. For motion control purposes, it is better to use the frequency where the magnitude is 0 db. In the example above, that frequency is about 30 Hz.
Another problem is using the 90-deg. delay rating for motion control. That’s because the actuator’s velocity is controlled by the valve, but we usually want to control position. Integrating velocity to position adds 90 deg. of phase delay. If the valve spool also adds 90 deg. of phase delay, the total phase delay goes beyond 180 deg. because other small phase delays must also be included.
When phase delay goes beyond 180 deg., the system oscillates. Practically, it is best to look at the frequency where the valve’s phase delay reaches 45 deg. and use that value as the valve’s usable frequency response. In the graph above, this happens at about 28 Hz.
The fact that spools are often slew-rate limited makes plotting Bode plots accurate. (Slew-rate limited valves have a maximum speed.)
Many valves have Bode plots with more than one line for gain and phase. There may be two or three plots measuring the responses at different sinewave amplitudes. Usually there is a plot for sine wave amplitudes with input signals for 5% travel. These responses are good, but one does not buy a 100-liter-per-minute valve to use only 5-liters-per-minute of its capability. However, it’s helpful to know the 5% response when doing pressure or force control because the valve’s pressure band is usually just a few percent around null. When making normal point-to-point moves, it is the response at 90-95% input that is important.
When designing position servo-control systems, engineers need to look at and understand at valve’s Bode plot to get a better estimate of the valve’s real capabilities and avoid unwanted surprises.
Peter Nachtwey is president of Delta Computer Systems.


