Hydrostatic Transmissions: A Power Play in Wind Turbine Design
Today, two different types of turbines dominate the market, both employing a three-bladed rotor with a horizontal axle of rotation. The first uses a mechanical transmission to transfer the slow-turning shaft of the turbine rotor into a higher rotational speed to drive a generator. The second doesn’t require mechanical transmission — a huge generator directly uses the high torque and converts it to electrical energy. In both cases, the generator’s rotation — and, therefore, the frequency of the electricity produced — are coupled with the turbine.
A major issue with these designs is that the turbine’s variable rotation speed requires a frequency converter to connect each turbine to the power grid. Other issues include reliability problems with mechanical gearboxes and the weight of the directly driven generator due to increasing turbine sizes.
A new concept — transferring power via a hydrostatic drivetrain — combines good efficiency and grid stability with high reliability and low costs. In a research project funded by the Federal Ministry for the Environment, Nature Conservation, and Nuclear Safety of Germany, the Institut für Angewandtes Stoffstrommanagement (IFAS), Hamburg, developed a prototype of a hydrostatic transmission for 1-MW power-class wind-energy plants that’s intended to replace the commonly used gearbox and the frequency converter.
The basic design employs a slow-turning pump connected to the turbine shaft to transfer the power into a high-pressure oil flow. Hydraulic motors then convert the oil flow back into mechanical power to drive a generator. The high transmission ratio needed in a turbine can easily be achieved by the displacement ratio of the pump and motor. Using a variable-displacement motor allows varying transmission ratio so that the generator runs at constant speed.
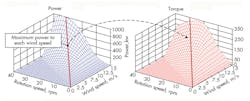
A key requirement when scaling a transmission is to have good efficiency at rated power as well as in partial load, which is where the turbine operates most of the time. The rotor also influences the total power output because energy captured from the wind can be optimized by adjusting the turbine’s rotational speed to the actual wind conditions. Figure 1 (over wind speed and over rotational speed) shows that a specific rotational speed maximizes the captured power at each wind speed. At the same time, these points of operation are not at maximum torque. To achieve peak power production of a wind turbine, the drive train should be designed for the optimum points of operation while using a control strategy to ensure operation in these points. Therefore, a compromise must be found between steady-state operation and controllability.
Transmission design
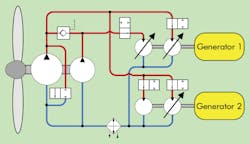
The initial point for dimensioning of the hydrostatic transmission was to select a wind turbine that provides a torque curve over wind and rotation speeds. Previous simulations proved that switching a hydrostatic transmission’s single pumps and motors increases the overall efficiency in partial load. Subsequently, different combinations of pumps and motors were analyzed, which led to the creation of a new transmission design, Figure 2.
Two radial-piston pumps, with a total displacement of 66 liter/rev, drive three variable-displacement motors and one constant-displacement hydraulic motor. The four motors are mounted to two generators. In partial load, the pump with 80% of the total displacement can be switched off by opening a valve to low pressure. Because a reduced flow rate is available to the motors, three of the motors are switched off at this point in operation.
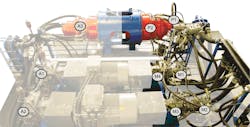
Not all component data for the simulation was available for this project. Therefore, a test bench was built to measure and validate static and dynamic parameters of individual components as well as the entire transmission, Figure 3. A hydrostatic power feedback was installed to operate the test bench efficiently as well as avoid a 1.2-MW electric motor and 1-MW generator. It allows using the output power of the transmission to drive the slow-turning input shaft.
Two electric motors, powering two axial-piston pumps (A1 and A2), feed in losses of the transmission and the drive. A radial-piston motor (A3) represents the wind turbine and drives the slow-turning shaft. Output power from the transmission is fed back to the electric motors. In this way, the electric power consumption is only 400 kW (2 × 200), whereas 1 MW can be applied on the turbine shaft.
Rotational speed and torque at all transitions of power across the system boundaries of the transmission is measured to evaluate the overall efficiency. In steady-state measurements, rotational speed is controlled by the transmission’s hydraulic motors, and the test bench drive applies a specific torque based on the displacement of the two axial-piston pumps.
Efficiency results
Initially, the transmission’s overall efficiency was measured in the point of operation of the turbine marked with the line in Figure 1. However, due to the possibility of adapting the transmission to the transferred power, measurements also were performed in a different configuration.
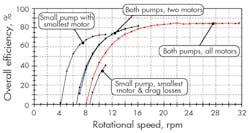
Overall efficiency from the slow-turning shaft to the output of the hydraulic motors was plotted versus turbine rotation speed, Figure 4. When activating both pumps and all motors, overall efficiency at maximum rotation speed is 85%. A decreasing rotational speed also decreases the transferred power, and constant losses in the system reduce overall efficiency.
Figure 4 indicates that when turbine shaft speed drops below 16 rpm, it’s best to switch off one of the generators and use only two motors. At even lower speed and much lower torque, one pump can be set to idle mode, leading to an increased system pressure and improved higher efficiency.
Another measurement in the plot shows that when the smallest motor is in operation, and another one is still connected to the generator shaft, it causes a constant amount of drag losses. In this case, the overall efficiency is worse compared to activating the motor and using two motors at a much lower displacement. For component scaling, this means that the rated power of the generators should be adjusted to the size of the pumps. Thus, a pump and a generator can be activated simultaneously to avoid drag losses of idling motors.
This file type includes high resolution graphics and schematics when applicable.
Control via variable displacement
Besides overall drive train efficiency, the effectiveness of capturing wind power dramatically influences the total power production. To achieve this goal, the blades’ optimal rotational speed must be adjusted by the drive train to the actual wind speed, again, as shown in Figure 1.
The turbine’s rotational speed can be adjusted by varying the displacement of the hydraulic motors. Because the generators operate at grid frequency, their rotational speed must be constant. Moreover, the motors’ swashplate angle can define the system’s flow. On top of that, the pumps have a constant displacement, leading to a proportional correlation of flow rate and rotational speed.
When opting for this strategy, the controller would have to use the actual wind speed and specify the optimal rotational speed according to the characteristics of the blades. The motors would then adjust for the desired rotational speed.
However, two major challenges arise with this approach. First, the actual wind speed is difficult to measure on a real wind turbine. The blades cover a large area in which the wind varies in speed and direction. A single wind-speed sensor mounted on top of the nacelle can hardly detect all these effects, so it will deliver only approximate values. The second challenge concerns the large inertia of the turbine itself, which makes it difficult to change the rotational speed in response to fluctuating wind speed and direction. Each short gust of wind would lead to a short acceleration of the turbine initiated by the controller. In this phase, all of the incoming power would be stored in the rotor’s inertia, leading to interrupted power production. After the gust, the controller would decelerate the rotor again and have an increased power output for a short time.
These fast load changes are possible with the hydrostatic transmission, but it complicates adapting the system to the actual load. When using the switching strategy presented in Figure 4, each harsh change of the braking torque involves the switching of several components. This type of operation must be avoided in order to maintain system reliability.
Control of transmission load torque
The wind turbine’s rotational speed also can be adjusted by controlling the braking torque of the transmission. If the rotational speed is too high, a defined amount of additional braking torque could be added to decelerate the turbine. However, the controller needs information about the actual wind speed to define the optimal rotation speed.
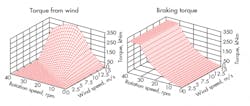
One way to avoid wind-speed measurement is to determine the wind situation according to the turbine’s acceleration. Such a method is used in a control strategy where the controller of the hydrostatic transmission applies a braking torque to the turbine based on the actual rotational speed (assuming an optimal point of operation). Figure 5 shows the torque equilibrium on the inertia of the rotor. The braking torque applied by the transmission on the right is independent of wind speed. When wind speed is higher than assumed, it captures more torque than discharged by the transmission, which accelerates the turbine.
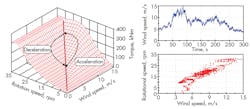
The left side of Figure 6 represents turbine operation, which was accomplished by maximizing both plots in Figure 5. A groove between the two surfaces occurs in which the turbine will operate in steady state. The marked arrows in the plot show the reaction on a gust of wind. Whenever a fast gust occurs, the captured torque will accelerate the turbine. As rotation speed increases, the transmission also increases the braking torque of the drive train. Once the gust fades, the braking torque becomes too high, which decelerates the turbine to the groove again. By varying the parameter of the torque curve deposited in the controller this groove can be adjusted to the optimal point of operation in which the overall efficiency of turbine and drivetrain is optimal.
The two plots on the right in Figure 6 show a simulation result of the controller. The upper curve describes the applied wind speeds on the simulated turbine, leading to the points of operation marked below. All points accumulate around a straight line defined by the groove shown on the left.
Unlike the motor-displacement-based control strategy, the torque-based control strategy makes power production smoother because the turbine’s inertia is used as flywheel to store peak power from the wind. No problems are encountered when switching between different transmission configurations since the braking torque can only change as fast as the rotation speed. Most importantly, the strategy is based on the rotation speed of the turbine, which can be measured precisely and cost effectively.
Validation of dynamic behavior
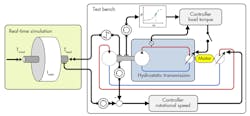
To verify the controller’s simulation results on the test bench, the tests must include the inertia of the turbine. Of course, it’s impossible to install such a huge flywheel directly on the test bench; therefore, it’s done virtually in a real-time simulation. Figure 7 shows how the simulated inertia is coupled to the test bench. The initial point is a torque signal that’s applied on the model of a flywheel. The inertia’s rotation speed is sent to the test-bench drive, where a rotation-speed controller sets the same rotation speed on the test bench.
The braking torque of the hydrostatic transmission is measured at the slow-turning shaft and transmitted into the simulation to be applied on the inertia as load torque. In the measurements described below, all units of the hydrostatic transmission will be in operation. However, two different setups are used: The first has all motors set to a constant displacement; the second activates a controller for the braking torque (discussed previously).
This file type includes high resolution graphics and schematics when applicable.
Scalable NREL rotor properties
Accurate rotor data is notoriously hard to come by, since turbine manufacturers are reluctant to disclose detailed information, particularly for publication. That said, for the purposes of this research, the U.S. National Renewable Energy Laboratory (NREL) offshore baseline turbine — a fictional turbine — was used. It’s become the standard reference turbine for numerous studies, mainly due to the fact that its properties are freely available. Some of its parameters were arbitrarily selected using engineering judgment; others were selected to match those of a 5-MW turbine developed by REpower Systems SE, Hamburg, Germany.
The properties assigned to the NREL turbine represent the current state of the art for offshore wind turbines. This infers that its principal components are a conventional drivetrain with a three-stage gearbox and an asynchronous high-speed generator. For more information, see the NREL technical report.4
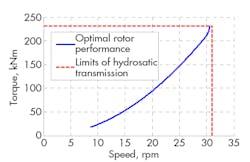
The nominal line pressure for dynamic loads on the hydrostatic transmission is set at 220 bar. This translates directly to a nominal torque of around 230 kNm. Maximum possible speed is approximately 31 rpm. These two conditions represent the limits for the operational range of the rotor simulation. When scaling down the rotor properties of the NREL turbine to match the transmission capability, the relation between power coefficient, CP, and tip speed ratio, λ, stays the same.
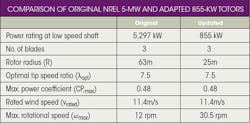
The maximum allowable rotor diameter is found by setting the torque and speed limits as rated power conditions of the wind-turbine rotor. Figure 8 shows the resulting optimal torque versus speed curve. Table 1 compares the rotor properties of the original NREL turbine with the version adapted to match the hydrostatic transmission.
Bladed wind-turbine-model simulation software
Obtaining a realistic response of the hydrostatic transmission requires accurate simulations of the aerodynamic rotor and wind conditions. In this regard, the multi-body dynamics software package “Bladed” from energy consultancy GL Garrad Hassan (Hamburg, Germany) is the industry-standard integrated software package for the design and certification of onshore and offshore turbines.5
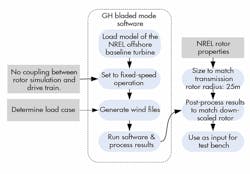
One drawback when using Bladed involves creation of the transmission input; the software isn’t suited for interactive use, i.e. hardware-in-the-loop. As a result, the drivetrain’s braking torque can’t be fed back into the program, which produces an unrealistic coupling between the simulated input and the transmission response. To make the coupling more realistic, the rotor-control settings are set to fixed-speed operation, Figure 9. This fixed speed is predetermined using the optimal tip speed ratio, λ, where the wind speed is the average taken from the wind file corresponding to the load case.
A wind file is required to run a simulation in Bladed (the software also creates these files). The nature of a wind file is determined by a number of user-selected settings, such as the mean wind speed, turbulence intensity, turbulence seed, yaw misalignment angle, inclusion of tower shadow (plus how it’s modeled), and the type of wind-shear profile. For more information on how this is achieved, see the Bladed manual.5 Output parameters of interest are the torque and angular velocity of the low-speed shaft versus time.
Adapt Bladed model results to a 50-m rotor
Results obtained from bladed model are scaled down to create the transmission’s input. They have to be translated from results of scaling from a 126 to a 50-m rotor diameter. Only steady-state relations are considered in this scenario, maintaining the same tip speed, vtip, and power coefficient, CP:
(1) vtip = ω1 × R1 = ω2× R2
(2) CP = Protor/Pwind = (T1 × ω1)/(½ρ u3 × π R12) = (T2 × ω2)/(½ρ u3 × π R22)
where ρ = air density, kg/m3;
Pwind = wind power through rotor area, W;
Protor= wind power extracted by rotor, W;
T = torque (N-m).
These result in the following translations for speed and torque:
(3) ω2 = ω1 × R1/R2
(4) T2 = T1× (R2/R1)2
The standard deviation of the torque with respect to the mean value is the same for both the original and the scaled rotor. This translation’s outcome doesn’t account for dynamic influence from changes in the rotor mass moment of inertia, dynamic stall, dynamic inflow, or Reynolds numbers.
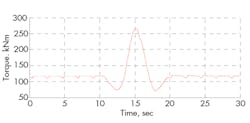
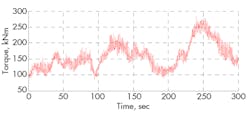
Figures 10 through 13 reveal the scaled results from Bladed for fixed-speed simulation of NREL’s offshore baseline turbine for an extreme gust and wind with turbulence intensity of 16.3%.
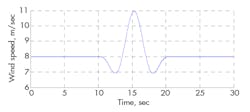
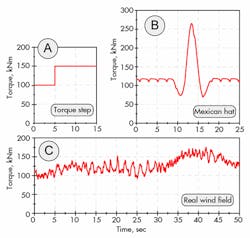
Three different load cases show the effects of the control strategy, Figure 14. Load Case A is a simple torque step from 100 to 150 kNm. Case B is the torque curve of a gust of wind, also called a “Mexican Hat.” Case C is a 50-sec segment of real operation. The data for the two last files was generated in the Bladed software.
This file type includes high resolution graphics and schematics when applicable.
Measurement results
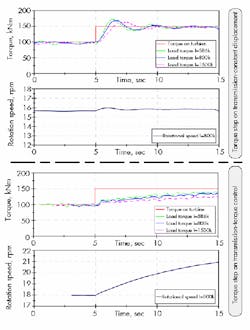
Torque step load case — Figure 15 illustrates the measurement results with an applied torque step. The two upper diagrams present the behavior of the hydrostatic transmission with constant motor displacement. The first graph plots the applied torque step and the resulting load torque measured for three different inertias of the turbine.
It can be seen that after the torque step occurs, the measured torque on the test bench also rises and oscillates to the new value. Due to the turbine’s increased inertia, the resonant frequency of the drivetrain decreases.6
The second plot from the top presents the effect on the rotational speed of the turbine. Rising pressure in the transmission increases the leakage, leading to slightly increasing turbine rotation speed. The higher the turbine’s inertia, the more energy that’s stored in the flywheel (with the slight change of speed).
The two lower plots display the same measurement, but in this case a torque-controlled transmission is employed. Here, the torque step leads to higher applied torque than braked by the transmission and, consequently, a rising rotational speed. The load torque on the test bench rises proportionally to the rotation speed until the equilibrium of torque is set again.
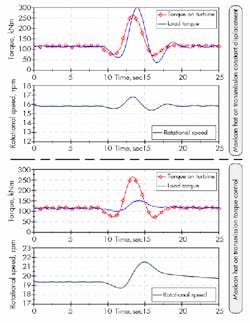
Gust-of-wind load case— The measurements performed in the torque step load case also were used in the Mexican Hat load case, Figure 16. With a constant motor displacement, only a short delay occurs between applied and measured torque. The rotation speed can only rise slightly. Therefore, the peak power delivered by the wind must be transferred by the transmission. Due to the elasticity of the hydraulic drivetrain, the measured torque on the test bench is even higher than the one applied on the inertia.
As with the previous load case, torque was measured on the test bench using a torque-controlled transmission (lower portion of Figure 16). Here, the turbine can speed up about 2 rpm and, thereby, store most of the peak energy of the gust. The maximum torque measured on the test bench is 120 kNm lower than the applied load. When this torque decreases, rotational speed also decreases, extracting stored energy in the flywheel and reverting to constant operation.
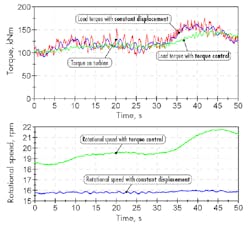
Real wind conditions load case —In this load case, all usual effects such as the tower shadow effect, short gusts of wind, and a changing wind speed in the long term were considered. Figure 17 shows the measured torque and rotational speed behavior with the two different control strategies.
If the motor displacement is set constant, the measured torque follows the applied torque and smooths out torque peaks with a short delay. Activating the torque controller enhances the power smoothening thanks to a changing rotational speed. The short oscillations of this torque signal show that the transmission controller must be optimized.
Conclusion
A wind turbine using a hydrostatic transmission can be controlled in one of two ways. Of the two, the torque-based control strategy delivers a good compromise between ensuring optimal rotation speed and guaranteeing continuous power production.
Results obtained by IFAS engineers from dynamic-behavior test-bench measurements support implementation of the control strategy. In a simulated load from an extreme gust, an uncontrolled response resulted in an amplification of the rotor torque. The hydraulic drivetrain can cope and the response quickly dampens, but the scenario is undesirable. On the other hand, a controlled response severely reduced the effect of the gust. The turbulent wind load case shows, although less apparent, that the controlled response presents a more smooth response. The smoothness of the drivetrain's response to dynamic loads contributes significantly to the quality of power delivered by a wind turbine.
The next phase of the project, again funded by the Fluid Power Research Fund, will bring together the different controller modules (with all required safety functions) switching the components and controlling the rotation speed. In parallel, all needed peripheral systems, such as cooler and supply pumps, will be installed at the test bench. An improved aerodynamic model that can run in the real-time simulation at the test bench will make it possible to apply direct data from wind measurements. Thus, the transmission will act as if it’s installed in a turbine. At the end of this project, the transmission will be ready to be installed in a pilot plant.
Johannes Schmitz, Nils Vatheuer, and Hubertus Murrenhoff are with RWTH Aachen University, IFAS, Aachen, Germany. Niels Diepeveen, is with Delft University of Technology, Netherlands. For more information, visit www.rwth-aachen.de.
This file type includes high resolution graphics and schematics when applicable.

Leaders relevant to this article:
