Simulation results for leakage parameters
The leakage input parameter was set to 2.75 in.3/sec for all the previous investigations. Now it is going to be seen how this value is only an estimate of the peak leakage that results from the simulation. Furthermore, the simulated peak leakage is affected by the amount of overlap that is used for any specific computer run.
Perhaps more importantly, though, the leakage parameter is just that: a parameter. It is directly tied to the amount of spool-to-bore radial clearance of the valve. The higher the leakage parameter, the greater the amount of clearance. Each new value for the leakage parameter establishes a new value for the physical overlap needed to produce critical lap flow metering.
To carry out the leakage study, a simulation program was run five times, and each time a new value for the leakage parameter was used. The values were set, run-to- run, to 0.2, 0.5, 1.0, 2.0 and 5.0 in.3/sec, respectively. The value for the input overlap was left at 0.85, which was the value that produced critical lap flow metering when the input leakage parameter was set to 2.75 in.3/sec.
KVL metering parameters
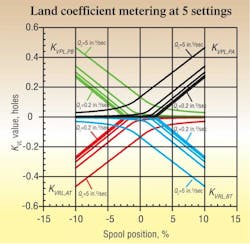
Figure 1 is indeed a busy one, what with four different valve lands and five different leakage parameters, all on one set of axes. Each land is labeled, and the minimum and maximum leakage parameters are indicated. It should not be surprising that increasing the input leakage parameter increases KVL value. Also, as the leakage increases, the transition region has a more rounded feature, while the lower leakages have sharper corners. This should not be surprising either.
Imagine that when the clearance is decreased (a lower value for the leakage parameter), the physical distance between the spool metering edge and sleeve’s metering slot will have to diminish at the transition point. This means that the transition from closed to open will be more abrupt, resulting in the sharper corner on the KVL curve.
Thus, we can see how the metering characteristics infer internal relative dimensions within the valve. This is especially true with KVL metering, which tells us something about radial clearances. Also, the tests can be used on a real valve in forensic situations. Erosion of the metering edges can be caused by years of use and accelerated if the fluid contains microscopic abrasive contaminants. Edge erosion will show up as increased leakage, and the forensic test results can be compared to the original performance data to assess the degree of the deterioration.
Flow metering parameters
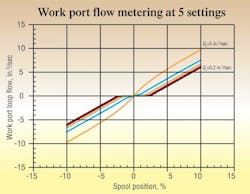
The flow metering curves of Figure 2 show more clearly how the leakage parameter affects the apparent overlap of the valve. It also shows how the leakage parameter affects the sharpness of the transition corners with decreasing leakage and decreasing radial clearances.
Notice how the highest leakage parameter value, 5 in.3/sec, produced a valve that is slightly under lapped. This should be obvious because of the increased flow gain at zero. The next lower leakage parameter, 2 in.3/sec, not labeled in the figure, produces a slightly overlapped curve. This tells us that some intermediate leakage parameter value will produce critical lap.
Leakage metering parameters
The simulated leakage characteristics in Figure 3 drive home the idea that the leakage parameter in the input data to the program is a parametric estimate of the simulated leakage. The maximum value of the input parameter was 5 in.3/sec. However, the simulated value is closer to 6 in.3/sec. On the other hand, an input parametric value of 2 in.3/sec produces a simulated peak of only 1 in.3/sec. Clearly, some input value would produce the same simulated value. The search for that value will be left to another study.
Figure 3 also shows that the value of the input leakage parameter and the subsequent value in simulation are related. However, that relationship at present is non-linear, but unknown. Also, due to graph scaling, the two curves for 0.1 and 0.2 in.3/sec are barely perceptible. Nonetheless, they are plotted, along the horizontal axis. Again, the input leakage parameter is best interpreted as a relative radial clearance as well as an approximation to the value of simulated leakage.
Pressure metering parameters
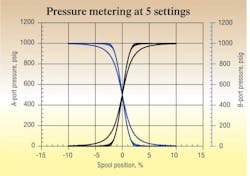
Pressure metering at various values of the leakage parameter is shown in Figure 4. The curves are all lying one atop the other for all the lowest values of the leakage parameter. Only when the parametric leakage results in apparent underlap do the curves begin to spread out. This is a result of the effective lap being under lapped.
Book details electrohydraulic control of pressure and cylinder force
For a more in-depth description of this book (including a full table of contents) and to browse other titles, go to www.hydraulicspneumatics.com/Bookstore-0. To order, fill-out the interactive PDF order form, and email, fax, or mail the form to us. To ask the author a question about the book’s technical content, email [email protected].


