Servovalves and proportional valves usually have a flow rating for a given pressure drop. Sometimes the pressure drop is expressed as the pressure drop across both ports or lands of the valve, and sometimes the pressure drop is expressed as a pressure drop across just one port. Textbooks have more detailed ways of calculating the flow constant, but they usually involve knowing variables such as the discharge coefficient for an orifice and the density of the fluid. Although we can estimate the density of oil accurately enough, we have no idea what the discharge coefficient of our valve happens to be.
The valve flow constant is determined by how the spool and spool sleeve are machined. Therefore, the only available numbers are the rated flow at the rated pressure drop. This information is usually provided by the valve manufacturer. The valve flow constant is usually expressed as:
How Do You Use This Information?
The short answer is, “very carefully,” because the units are very odd and not very intuitive. For simplicity, I will not show them here. I prefer more intuitive units. For a 100 l/min NG10 valve, I prefer to use
The flow is converted m3/sec or in.3/sec because velocity is usually expressed as a distance per second. When using metric units, I prefer to use the basic MKS units and convert millimeters to meters for calculations, then convert meters to millimeters for display since velocity is usually expressed as mm/sec. Keeping the units consistent is a major nuisance.
Using the Valve Flow Constant
Two parameters are important for computing the flow. First is the pressure drop across the port. The second parameter is how far the port flow path is open. A scaling factor representing the spool position is a clean method for expressing the valve opening. Because we do not know the maximum spool opening, it is good enough to use a value of −1 to 1, where −1 indicates the valve is fully open to the B port for retracting, and 1 is fully open to the A port for extending. A value of zero is used to represent the neutral position. A value of 0.5 is half open and extending. I use the symbol xs for the spool position. The spool position changes both as a function of the control signal to the analog input, and of the valve’s response.
If we want to avoid using the valve flow constant, this equation could be used instead:
To avoid division and square roots, use the valve flow constant:
So far, we assumed the valve is linear; therefore, the flow constant can be multiplied by the spool position. Good-quality servovalves provide almost-linear behavior and allow this simplification, but some valves are not linear. In the non-linear case, the valve flow constant changes as a function of spool position, xs. Compounding the problem is that flow is a non-linear function of the spool position. The equation for flow must be changed to this:
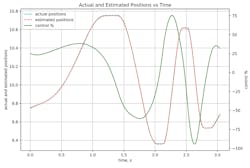
Valve manufacturers do not supply formulas for the non-linear valve flow. This formula must be derived empirically. This is possible to do with the right equipment and knowledge. We have had some success by creating a model with 15 parameters. There are 10 gain regions, a valve offset, dead time, and other parameters dealing with response time. The illustration shows the results of modeling a small valve with a dead band of about 20%. This valve would not be good for servo control.
The illustration shows the response to a swept sine wave control signal. A model was obtained that closely matches the estimated position to the actual position. Notice that the Estimated Postions line overlays the Actual Positions line. A model of this accuracy could, in theory, allow a motion controller to compensate for the valve’s deficiencies. The problem is that the spool would need to move extremely fast to go from +20% to −20%. Physical limitations on the spool speed make this impossible.
Valves are not easy to model because of the hydraulic equipment, data acquisition equipment, and software that must be used. In our case, for example, our hydraulic pump does not have adequate capacity to characterize valves at frequencies much above 5 Hz. Valve manufacturers should have the resources to model their valves. It is a shame that the specification sheets do not provide better information for those who want to design hydraulic servo systems.
Using the Valve Flow Characteristics in Simulation
Hydraulic simulations usually are conducted to determine velocities, flows, and pressures as a function of time. Spool position usually is not fixed, and it changes as a function of time and the control signal. In our case, the spool position is itself a function. Assuming the valve is linear, the result is an equation like this:
This is a formula for the flow as a function of time. The symbol u is what controls engineers use to indicate a control signal. The control signal in the formula above varies as a function of time. In dynamic situations, the pressure drop across a valve port will also change as a function of time. A lot of variables change at once in simulations.
This article is a “warm-up” for what is to come. Detailed discussions of the VCCM (Valve Control of Cylinder Motion) equation requires knowledge of all the parameters that make up the VCCM equation. Most of the parameters that are used are obvious, but the valve flow constant is not. I felt the valve flow constant needed to be explained in more detail before tackling the VCCM equation, and then how to use it to calculate cylinder and valve size.
Peter Nachtwey is president of Delta Computer Systems Inc. and has more than 35 years of experience developing industrial control systems for hydraulic, electric, and pneumatic applications. In addition to leading Delta’s engineering and R&D programs, he contributes widely to the mathematical understanding of control theory, especially in fluid power systems.
About the Author
Peter Nachtwey
President,
Peter Nachtwey has more than 35 years of experience developing industrial control systems for hydraulic, electric, and pneumatic applications. He graduated from Oregon State University in 1975 with a BSEE and served as an officer in the U.S. Navy until 1980. He became president of Delta Computer Systems Inc. in 1992. In addition to leading Delta’s engineering and R&D programs, he contributes widely to the mathematical understanding of control theory, especially in fluid power systems. He has also presented technical papers for IFPE, NFPA, FPDA, and various global technical conferences.

Leaders relevant to this article:


