NFPA Releases Latest Figures for Fluid-Power Product Shipments
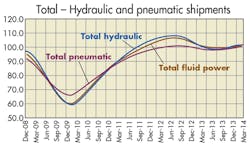
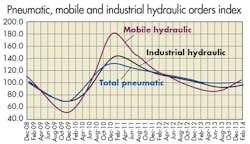
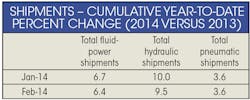
Data published for April 2014 by the National Fluid Power Association shows industry shipments of fluid-power products increased 3.4% compared to April 2013, and decreased 1.6% compared to last month. Industrial hydraulic and pneumatic shipments increased and mobile hydraulic shipments decreased in April 2014 when compared to April 2013. Mobile hydraulic and industrial hydraulic shipments decreased and pneumatic shipments increased when compared to last month. The charts shown here are drawn from data collected from more than 80 manufacturers of fluid-power products by NFPA’s Confidential Shipment Statistics (CSS) program. Much more information is available to NFPA members, which allows them to better understand trends and anticipate changes in their market and the customer markets they serve. Contact NFPA at (414) 778-3344 for more info.


