Advances in Electronic Control of Hydraulic Servo Systems — Part 2
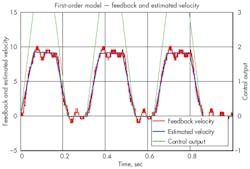
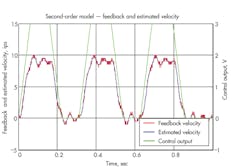
Figures 1 and 2 contain two graphs showing how you can use the measured velocity and control output to generate a first- and second-order model, respectively. The feedback velocity in red is calculated using a simple method. The resolution of the feedback device is 0.001 in., but the velocity is calculated over a time span of 2 msec, so the resolution of the feedback velocity is 0.5 in./sec. You can see that the estimated velocity is much smoother because it’s generated by the model, whereas the feedback velocity from a first-order model doesn’t follow the changes in the actual model very well. On the other hand, the estimated velocity for the second-order model follows the feedback velocity much more closely than the first-order model and best represents how the actual system is moving. This indicates that the system is a second-order system, behaving like a mass between two springs.
So where does the model that estimates the velocity and acceleration come from?
Auto tuning
Auto tuning is a feature supported by some electronic motion-control systems and is necessary when using advanced features — such as the second-derivative gain and the jerk feed forward — because few hydraulic-control-system designers have experience tuning them manually. The two parameters can be determined roughly by trial and error, but having a method of determining the gain, damping factor, and natural frequency quickly is important to reduce start-up time and shorten the time it may take to retune a system as the mechanics change.
Auto tuning is a way of estimating the model of the actuator and load using the control output to the actuator and the position and velocity response, as in Figures 1 and 2. Models can be complex, but usually you can achieve 95% of the benefit with 5% of the effort if the model is kept relatively simple. A hydraulic actuator and load can be modeled simply as a mass between two springs. Therefore, the model would consist of a gain, damping factor, and natural frequency. You can estimate the gain and natural frequency at design time using the VCCM equation and the formula for natural frequency (see box on page 40).
The damping factor is more difficult to estimate, but a typical damping factor ranges from 0.3 to 0.4. Even a rough estimate of the damping factor can allow entering these parameters into the motion controller’s built-in simulator. This lets you get started before the machinery is built. A controls person in the field can perform auto tuning to find the actual gain, damping factor, and natural frequency.
Auto tuning isn’t totally automatic. A procedure is conducted to move the actuator in a specific way, usually via open-loop control. The relationship between the control output and the position or velocity data is estimated by trying a value for each of the three parameters (gain, damping factor, and natural frequency) and then checking to see how closely the estimated position or velocity follows actual the recorded position or velocity. An evaluation can be done by summing the square of all the errors between the estimated and actual position or velocity. The three parameters mentioned above are changed in an effort to minimize the sum of the squared errors. This is a trial-and-error process, but a computer can do so quickly that it seems instantaneous. When the computer is done, it has found the best values of the gain, damping factor, and natural frequency.
The results
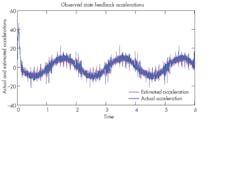
A true test is to move the actuator using a sine-wave motion profile. The actual or true velocity and acceleration will smoothly go through a range of values, and the goal is to estimate the velocity and acceleration accurately so the actuator can follow the target accurately. Low-resolution feedback will make the quantizing effect obvious because the velocity calculated directly from the feedback will change in steps. The goal of the model-based control is to estimate smooth velocities as shown below.
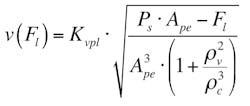
The VCCM equation
Fl = load force that must be overcome,
PS = supply pressure,
Ape = cylinder size,
v = speed of cylinder propulsion,
Kvpl = degree to which the valve is open,
ρv = symmetry of the valve, and
ρc = cylinder area ratio (cap end of piston area/rod end area).
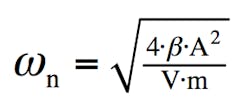
Natural frequency:
β = bulk modulus of fluid,
A = surface area of the piston,
V = volume of the cylinder, and
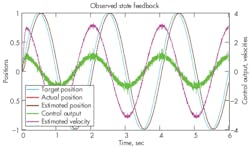
m= mass of the load.The graph in Figure 3 shows how an actuator with a gain of 3 in./sec, damping factor of 0.4, and a natural frequency of 10 Hz can be controlled using a PID with a second derivative gain.
The feedback is truncated to 0.001 in. to simulate a start-stop magnetostrictive linear-displacement transducer rod with a position feedback of 0.001 in. As noted, the resolution of the measured velocity would be 1 in./sec, and the resolution of the acceleration would be 1,000 in./sec2. Figure 3 shows that the estimated position is so close to the actual position that they look like one line. The estimated velocity is relatively smooth compared to what could be achieved doing simple velocity calculations, where the resolution would be 1 in./sec. The control output is essentially tracing a 1-V peak-to-peak sine wave to control the actuator. A little noise occurs in the control output from errors in estimating the velocity and acceleration, but it isn’t as bad as what would occur without estimating the velocity and acceleration with the model.
If the model wasn’t used, the control output would simply be changing from 10 to –10 V because of the inability to estimate the velocity and acceleration. Without the model-based velocity and accelerations, the PID and second-derivative gains would need to be drastically reduced to keep the control output from swinging 10 V peak to peak.
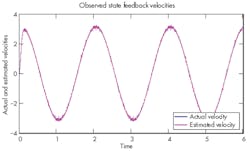
Figure 4 shows the actual and estimated velocities. The plot actually contains two lines, but the estimated velocity is almost identical to the actual velocity, so the estimated velocity line is on top of the actual velocity line. Again, notice that there is no 1-in./sec quantizing.
As expected, the estimated acceleration, shown in Figure 5, shows the effects of feedback quantizing, but spikes of 4 or 5 in./sec2 are a lot better than errors of 1,000 in./sec2. The estimated acceleration curve still does a good job of following the actual acceleration.
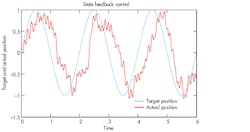
Now compare the model-based control from Figure 5 to control without the model shown in Figure 6. The same gains are used as in Figures 3, 4, and 5. The control output isn’t shown because it changes from –10 to 10 V from the effects that the quantized velocity and acceleration have on the control output. Because the control output is often saturated, the actuator is being controlled as if the valve is a simple on-off directional-control valve.
You can control systems that would otherwise be uncontrollable by implementing model-based control with an electrohydraulic motion controller that can run second-order algorithms. The alternative would be to design systems with a high damping factor and natural frequency, but this would increase the system cost.
Peter Nachtwey is president of Delta Computer Systems, Battle Ground, Wash. For more information, call (360) 254-8688, or visit www.deltamotion.com.
About the Author

Leaders relevant to this article:
