Flow profiles in motion control applications
An important issue that arises when engineers implement motion control technology is that the parameters that are most difficult to predict are specified as parameters that must be strictly controlled. For example, if we know the system pressure, we often attempt to calculate the resulting acceleration after a valve shifts. The simplistic calculations never deliver the actual acceleration that results after the system is built. More often than not — and especially so in systems with very high mass load — the actual acceleration and velocity are very springy and rife with vibration and noise.
With motion control technology, we control the acceleration at the outset; it is a specified input to the motion controller. The design methodology forces designers to take into account such obscure parameters as valve bandwidth and hydromechanical resonant frequency. Designers then must apply clear pass-fail criteria to assess the adequacy of the design before ever committing to hardware.
The basic reason for this happy state of affairs is that things normally hard to predict are brought under our positive control. That is the case with acceleration, velocity and position, all of which are simultaneously controlled. The immediate outgrowth is that the flow profiles are very rigidly defined as well. Knowledge of the tightly controlled velocity profile makes it simple to get a clear picture of the flow profile. We need only take into account which valve port is being evaluated, along with the cylinder area that is controlling the flow. We must also take into account the fact that the P-and T-port flows are always unidirectional, whereas work port flows are always alternating.
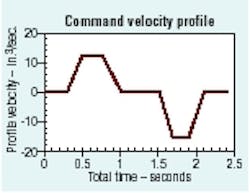
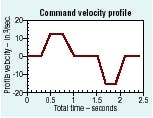
Consider the velocity profile in Figure 1. It has different extension and retraction velocities, as well as different acceleration and deceleration times. In short, the profile is not symmetrical. The P-port flow is calculated by multiplying the rod extension by the piston area. Likewise, T-port flow is calculated by multiplying the retraction velocity of the rod-end piston area.
Two things should be apparent. First, these two equations are valid for any speed, even during those times when the speed is changing. Second, the two flows are not necessarily the same. They could be — if the area-velocity products are chosen to be equal.
Example problem
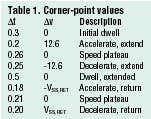
A 4-in. bore cylinder with 2½-in. rod diameter is used in a motion control system. The velocity profile is shown in Figure 1. The corner-point values for the profile are given in Table 1. Based on these values, assume we must:
- calculate the total distance travelled during extension
- determine the total cycle time
- calculate the required retraction speed
- construct flow profiles and calculate pressure-port flow and tank-port flows.
Extension distance is found by using the geometric method of integrating the velocity:
XT = ½VmaxΔT1+VmaxΔT2 +½Vmax ΔT3
= ½ (12.6 .2) + (12.6 .26) + ½ (12.6 .25)
= 6.111 in.
Total cycle time is found by adding up all the individual time intervals:
TT = 0.3 + 0.2 + 0.26 + 0.25 + 0.5 + 0.18 + 0.21 + 0.2 + 0.3
TT = 2.4 sec.
Retraction speed (velocity at the constant speed plateau) is actually the maximum velocity, which is:
Vmax = XT ÷ ( ½ ΔT1 + ΔT2 + ½ ΔT3 )
Constructing flow profiles
The flow profiles can be constructed from the velocity profile by reconciling the extend velocity and the retract velocity with the respective cylinder area. All four combinations of velocity multiplied by area need to be calculated, so the cap-and rod-end areas first must be determined:
Acap = 12.5664 in.2
Arod = 7.6576 in.2
Now we can calculate the maximum pump-port flow during extension:
QPEmax= VEmax × Acap
QPEmax= 12.6 × 12.5664
= 158.3 in.3/sec
Next, we calculate maximum pump-port flow during retraction:
QPRmax= VRmax× Arod
QPRmax= 15.275 × 7.6576
= 117 in.3/sec
Now we calculate maximum tank-port flow during extension:
QTEmax= VEmax × Arod
QTEmax = 12.6 × 7.6576
= 96.49 in.3/sec
Finally, we calculate maximum tank-port flow during retraction:
QTRmax= VRmax × Acap
QTRmax= 15.275 × 12.5664
= 192 in.3/sec
Average flows — Space limitations prevent delving into calculations for average flows through the P and T ports during extension and retraction, but the values are interesting.
Average flow through the P port is found by taking the total swept volume through the P port (the sum of the extension and retraction volumes) divided by the total time. During extension, the volume is 76.78 in.3/sec, whereas, during retraction, it is only 46.8 in.3/sec. The average P-port volume, then, is:
(76.78 + 48.8) × 2.4 = 51.49 in.3/sec.
Similarly, average flow through the T port is found by taking the total swept volume through the T port (the sum of the extension and retraction volumes) divided by the total time. During extension, the volume is 46.8 in.3/sec, whereas, during retraction, it is 76.8 in.3/sec. The average T-port volume, then, is:
(46.8 + 76.8) × 2.4 = 51.49 in.3/sec.
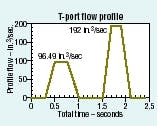
It should not be surprising that the average flow is the same in both the pressure and the tank ports of the control valve. The peak flows are worth pondering, because the peak tank port flow is nearly 50 gpm (192 in.3/sec), while the average flow is only about ¼ of that. The complete Pport and T-port flow profiles are shown in Figures 2 and 3.
Selecting acceleration and acceleration time
In the design of electrohydraulic motion control systems, it seems that the maximum forces and speeds are relatively easy to determine at design time. Acceleration, on the other hand, seems to be more problematic. Load restrictions may limit the acceleration in order to prevent slopping of contents or tipping. Furthermore, the control valve may function better if acceleration is limited.
An explanation usually is referred to in manufacturers' technical literature on valve frequency and step responses. But, in a nutshell, many proportional valves are equipped with dynamically enhancing electronic drivers. These drivers use over-driving circuits to enable the valve spool to respond faster than it is naturally inclined. However, this produces fast response for small excursions of the spool and slower response for large spool excursions. The direct outgrowth of this phenomenon is that the frequency response plots show that the valve may have a bandwidth of, say, 100 Hz at 10% of spool travel, but the bandwidth may only be, say, 30 Hz, at 90% or 100% of spool travel.
Many manufacturers of such valves also publish the step responses for these valves. The step responses are tabulated or displayed in terms of the percent of spool travel involved. The unique characteristic of valves dependent on the test amplitude is this: The time for the spool to reach its final command position depends on the amplitude of the command signal to the valve. For example, it may take only 20 msec to reach 25% of full shift spool position, but 80 msec to reach 100% to shift completely. Such dependency is intuitively comfortable. However, the designer faces a dilemma: What response should be used in designing and verifying the system?
The rule of thumb is: Do not program an acceleration time for any phase of the motion profile that is shorter than twice the time for the valve to achieve full shift. This strategy is based on the approximation that the rate at which the valve shifts is approximately proportional to the resulting load acceleration. Making the acceleration time twice the slew shift rate of the valve helps percent saturation of the electronic elements. Therefore, the valve can be treated as if it behaves as given in the small signal test — as if it has the highest possible bandwidth.
Finally, hydromechanical resonance may be excited with short acceleration times. Especially in systems that have low hydromechanical resonant frequency and low hydromechanical damping, the minimum acceleration time can be estimated from:
ΔTA,min < 4÷ ξT ωn
Where ΔTA,min is minimum acceleration time required to avoid exciting the hydromechanical resonant frequency.
ω is the hydromechanical resonant frequency in radian/sec. It is equal to the hydromechanical resonant frequency, in Hz, multiplied by two .
ω is the total combined hydraulic and mechanical damping ratio at the actual hydromechanical resonant frequency.
Keeping the acceleration time longer than the above value will help ensure the load will accelerate and decelerate smoothly.


