This file type includes high-resolution graphics and schematics when applicable.
Pneumatic cylinders are widely used throughout industry because of their relatively large output-power-to-size ratio, easy operation, safety, etc. However, precise control of these cylinders can be difficult due to their highly nonlinear friction characteristics and the compressibility of air. Consequently, their applications are limited to point-to-point control operations.
To achieve accurate positioning of a pneumatic cylinder, the nonlinear friction characteristics need to be made clear and expressed by a mathematical model. In addition, by developing a mathematical model for the friction characteristics, the dynamic behaviors of a pneumatic cylinder system can be accurately predicted by simulation at its design stage. This helps reduce design time, enhance the quality of controller designs, and improve component selection.
Some characteristics of nonlinear friction on pneumatic-cylinder motion are well documented, as are the experimental and numerical studies of the friction between the seals and the cylinder bore, especially stick-slip motion. Many of these studies focus on the chaotic oscillations that occur during low-speed actuation. Other studies investigated the dynamic friction behavior of pneumatic cylinders—however, experimental conditions were limited, and vibration characteristics were not examined. Therefore, the nonlinear friction behavior of pneumatic cylinders still has yet to be fully examined and modeled.
The study presented here investigates the dynamic friction and vibration characteristics of a pneumatic cylinder, as well as the relation between the friction and vibration.
Experimental Apparatus and Method
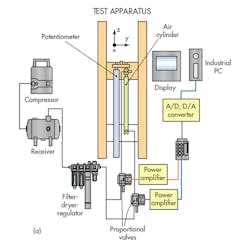
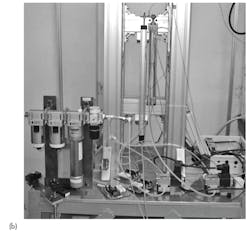
Figure 1 shows a simplified representation of the experimental apparatus. A standard pneumatic cylinder was used for the test. It had a bore of 32 mm, rod diameter of 12 mm, and stroke of 300 mm. The test cylinder was fixed perpendicular to a horizontal table. A potentiometer and two pressure sensors were used to measure the cylinder’s piston position and pressures in its rod- and cap-end chambers. Three accelerometers attached to the cylinder measured the vibration of the piston in the x (radial), y (radial, perpendicular to x), and z (axial) directions.
In the experiments, the cylinder operated only when extending the piston rod. The flow rate of air supplied to the cylinder was controlled by the proportional flow-control valves. The piston speed was varied in a stepwise or sinusoidal profile to investigate the steady-state and dynamic friction characteristics and their effect on the vibration characteristics. Piston speed was calculated by differentiating the position over time.
Friction force is obtained from the equation of motion of the pneumatic piston:
F = p1 A1 – p2 A2 – mg – ma
where F is the friction force; m is the mass of the pneumatic piston; p1 and p2 are the pressures in rod- and cap-end chambers of the cylinder; A1 and A2 are the areas the rod- and cap-end sides of the piston; a is the acceleration of the piston; and g is acceleration due to gravity.
Test Results
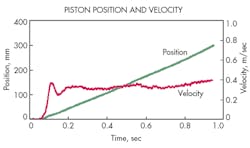
Figures 2 and 3 show a typical example of the measured position, velocity, friction force, and acceleration in the z (axial) direction of the cylinder when a stepwise signal was supplied to the proportional control valves. Fig. 2 illustrates how the linear variation of position and velocity varied in nearly incremental steps.
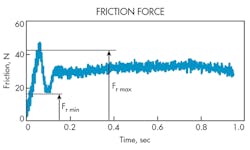
Figure 3 shows the variation of the friction force with time and reveals three observations. First, the maximum friction force (Fmax) appears immediately as the cylinder’s piston begins to move. Second, the minimum friction force (Fmin) occurs just after the maximum friction force. Third, a relatively steady friction force eventually occurs. Friction characteristics similar to Fig. 3 were observed at different stepwise velocities.
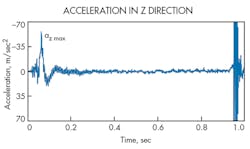
Figure 4 illustrates the variation of the acceleration in z axis with time. The components of acceleration in x and y radial are not shown because they were negligible relative to the z component. The beginning of the piston’s movement in Fig. 4 shows that the maximum acceleration az max, occurs while the friction force rapidly decreases from maximum to minimum. Vibration characteristics similar to this were observed for other step changes in velocity.
Static friction force occurs on the cylinder’s contact surfaces until just before the piston starts to move. Increasing air pressure in the cylinder, of course, increases the force acting on the piston. When the force exceeds the maximum static friction force, the piston begins to move. At that instant, the friction force suddenly decreases due to the Stribeck effect—the negative resistance characteristic of friction. Therefore, the piston accelerates rapidly.
The Case for Half-Period Sinusoidal Velocity Variation
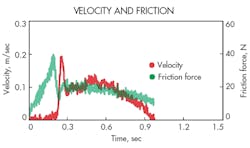
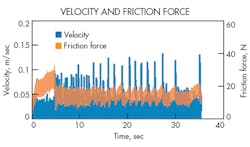
Figure 6 shows a typical example of the measured velocity and friction force when a half-period sinusoidal signal was supplied to the proportional control valves. Velocity varied almost sinusoidally except for the overshoot observed at the beginning of the motion. The variation of friction force with time, as seen in Fig. 6, indicates that maximum friction force appears immediately after the beginning of cylinder operation and minimum friction force is observed just after the maximum friction force.
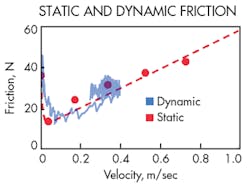
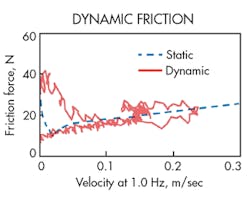
Dynamic-friction-force behavior at 1.0 Hz of the half-period sinusoidal velocity variation is given in Figure 7. The dynamic friction force, which is larger than the steady-state friction force during the acceleration period, traces the steady-state friction characteristic during the deceleration period, except for the negative resistance regime. We found that increasing the frequency of the velocity variation increased the size of the hysteresis. These behaviors agree with those reported by Tran, Wakasawa, and Yanada in “Behaviors of Pneumatic Actuators,” presented at ICMDT 2011.
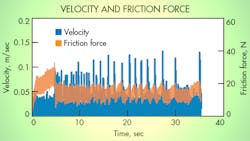
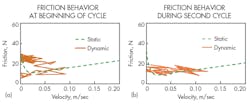
Stick-slip motion occurred at the mean velocity of 0.010 m/sec (Fig. 8). Figures 9a and 9b show how repeated velocity variations from zero to about 0.1 m/s caused the friction force, likewise, to oscillate.
Figure 9a reveals the friction force behavior for the values of Fig. 8. Maximum friction force appears immediately after the beginning of cylinder operation. Figure 9b illustrates the hysteresis loop during the second cycle. As can be seen, the hysteresis loop is significantly smaller than that shown in Fig. 9a, even though the friction force is nearly constant.
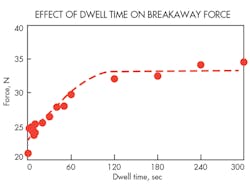
We also examined the effect of dwell time on dynamic friction characteristics. Figure 10 shows the effect of the dwell time (td) on the breakaway force (Fb). As can be seen, the breakaway force increases with dwell time, but tends to approach a constant value as dwell time exceeds 120 sec.
Conclusions
The friction and vibration characteristics of a pneumatic cylinder in practical operations were examined under stepwise and half-period sinusoidal velocity variations. Tests indicated that a relatively large acceleration is caused at the start of cylinder motion, resulting mainly from a steep decrease in friction force immediately at the onset of motion.
Hysteresis is frequency-dependent during acceleration and deceleration periods. Furthermore, a constant friction characteristic in stick-slip motion has been indicated. Modeling of dynamic friction behaviors will be the subject for a future study.
Yasunori Wakasawa and Yuhi Ito are associated with the Toyota National College of Technology and Hideki Yanada is with Toyohashi University of Technology, both in Japan. This article is based on a paper presented at the Third International Conference on Design Engineering and Science, Pilsen, Czech Republic.
Looking for parts? Go to SourceESB.
This file type includes high-resolution graphics and schematics when applicable.
About the Author
Yasunori Wakasawa
Yuhi Ito

Leaders relevant to this article:
