Improving Compressed Air System Efficiency: Part 4
When sizing pipe for a compressed air system, keep in mind that without resistance to flow, there is no flow. Some pressure drop or some mass flow resistance is necessary. The amount of pressure drop only needs to be hundredths of a psig for the system to work, but it can be very high — and, therefore, inefficient — if you size the pipe incorrectly for the required flow and pressure. Both the energy efficiency and cost of the system are function of your decisions.
As the pressure differential increases in the system, more energy will be needed to support the same results. Compressor manufacturers usually define this energy requirement as 0.5% of the total connected brake horsepower for each psig of elevated pressure. This relationship is theoretical and highly unlikely to occur in the real world. If the system is balanced and all operating stations are regulated below the lowest supply pressure, it may be true. If the demand were 100% controlled and raising the pressure changed nothing (including isothermal efficiency), the adjustment of supply pressure would equate to 0.5% of the total connected on-board energy per psig of elevation. This generalization assumes compressors are operating at approximately 100 psig. (In over 800 systems audits my company has performed, only two systems were balanced and neither owner/operator knew what they had done to accomplish this.)
The 0.5% theory also assumes that the supply mass produced or pounds of gas are not effected by changes in pressure. In all cases, the change in operating pressure adjustment will have some influence on mass. Sometimes it can be favorable, depending on the type of compressors and the design pressure relative to the operating pressure.
In the more likely event that a portion of the total use volume is unregulated or has regulators wide open (this includes leaks), then the elevation of pressure will increase the demand volume proportionately — with a correction for the specific density of the gas at operating pressure. In an unregulated system at 100 psig, if the pressure is increased by 10 psig, the volume and supply energy to support it will increase by 10.75% plus 5% for increasing the supply pressure — a total energy increase of 15.75%. If half the total system’s volume was unregulated, the increase in energy would be 10.375%. If the elevation of pressure is achieved by adding a compressor, and the existing compressors run at part load as a result, the increase in onboard energy could be as high as 50%.
Differential pressure in the system changes as a square function of flow, Figure 1. We have X volume of air flowing through a 2-in. pipe in the header system with a resulting 2 psid pressure drop. Doubling the flow increases the differential pressure four times, to 8 psid. So, if a new actuator is added downstream (which would require double the flow through the pipe), the system’s pressure at the supply would have to be increased by 8 psig in order to maintain the same resulting pressure at the point of use.
Pressure in the system is a function of volume. To elevate the system’s pressure, the volumetric input from the compressors must be increased. This will cause an exponential increase in the differential across the drying and filtering equipment and increase the velocity. That will increase the latent heat load on the cleanup equipment and reduce the contact time for drying. The elevated pressure will increase the volume of all unregulated users in the system, including leaks. The impact across the entire system may require an 11- to 12-psig increase in compressor pressure to provide the same pressure at the point of use. When the system pressure is increased, the dew point will rise, resulting in additional water contamination. Because most compressors have a 10- to 15-psig operating range, a 10-psig increase in supply may require another compressor. Depending upon the size and the part-load efficiency of the unit, the operating cost of the system may increase 25% to accommodate a 50 cfm application. Measuring the differential and evaluating the impact of the user on the piping could result in applying a $50,000 solution to a $100 problem.
Sizing the piping system
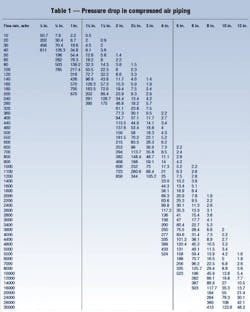
As we work through sizing, we will refer frequently to Table 1. Many pressure drop charts are available. The reason for using this one is that you can calculate resistance to flow for any flow, pressure, atmospheric pressure, pipe size, or length. The formula to use with the table is as follows:
PL= (FLAP1)/(1000P2)
where:
PL= pressure loss in psi,
F= the factor intersecting on the table with selected scfm rate of flow and pipe diameter
L= length of pipe, in feet, as determined for this specific calculation,
A= correction factor for valves and fittings (if you calculated each valve and fitting, it would take forever); a reasonable factor for adjusting these losses would be 1.2,
P1= atmospheric pressure in psia, and
P2= initial pressure to the pipe section you are calculating expressed as gauge pressure ` P1 in psia.
You can also use Table 1 when you measure the differential across a given pipe size and length and want to determine the flow associated with the differential.
A major error in systems sizing which has been present in the past is how to determine flow requirements. We have been taught to apply use factors to using equipment to determine the system requirement. This can also be referred to as diversity. Here we apply a percentage of time the equipment is in use. This is also referred to as a use factor. As an example, a pneumatic hand tool may consume 30 scfm at 90 psig continuously and be used no more than 30% of the time. The tool may be considered to have an average consumption of 9 scfm at 90 psig. For determining average load on the compressors, this is reasonable. It is not reasonable for sizing the components that transmit air to the inlet of the tool. Even though the tool may only consume 9 ft3 in a cycle once per minute, it consumes 30 scfm during that fraction of a minute it is in use.
Sizing must be done based on rate of flow, not average flow.If you sized the particular drop for the diversity factor, you would have a high pressure drop, which is common in most applications. It is not unusual to see 10 to 20 psig at the point of use. As we expand this problem, the probability of several tools being used at the same time increases as the cycle durations shortens. All of the users will flow at their rate of flow in scfm, which will cause a high momentary pressure differential. If you operate the system based on minimum allowable pressure, operators will complain of the low pressure in their part of the piping arrangement and, consequently, the system’s pressure will be raised to compensate. The closer you get to the users, the greater effect this problem will have on low pressure.
Other sizing issues
Fast-acting valves, such as pulse valves on dust collectors, are often misapplied. The typical pulse time is 0.1 or 0.2 sec. If the valve discharges 1 std ft3 of air in 0.1 sec, the rate of flow would be 600 scfm. Some manufacturers insist that if this happens 10 times per minute at 1 std ft3 per cycle, the valve is using 10 scfm.
Another element of this particular sizing problem is the pressure. Most equipment manufacturers provide the initial pressure that they want as the pressure requirement. There are two issues here. One is: where are they specifying the pressure? Is it at the inlet to the tool or valve or is it at the inlet to the filter-regulator upstream of hose, disconnects, and fittings? In most cases, it is the latter. If the manufacturer assumes a 15- to 20-psig pressure loss through those components, the system may be operating at an unreasonably high pressure and cost. The second issue is that sizing is not based on initial pressure, but article pressure (the lowest pressure at the using equipment’s final fitting).
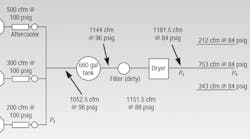
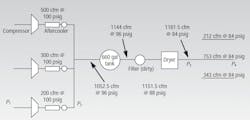
When averaging in evaluating the cumulative demand, a process flow diagram should be used, Figure 1. (This is normally done in a tabular format). List the air-using equipment in flow per minute. Use factors are applied and the percentage established is moved to the right hand column. Then, the factored volumes are added up, regardless of pressure — this is called the demand. The total factored volume is then expressed at the highest single use pressure of all components. The supply compressors are sized on this basis. All of the system components are then sized based on the rate of flow of the compressors, including dryers, filters, and piping. A receiver or receivers are also included in the components selected. Storage tanks and piping will increase the rate of flow based on their volume per unit pressure capacitance and how much the designer plans on allowing the pressure to fluctuate.
The highest rate of flow of the system from both the supply and demand perspectives must be carefully determined, in order to achieve the desired pressures at the point of use with the lowest energy needed at the supply end of the system.
Let’s say the compressors are capable of 1000 cfm at 110 psig. The total system capacitance for piping and tanks is 45 ft3 per psi. If the pressure is allowed to fluctuate 10 psig, the downstream components would have to be sized for:
1000 cfm + [(45 cfm/psi)×10 psi] = 1,450 cfm
Thus, 1,450 cfm is the highest supply rate of flow. The calculations should be done progressively outward from the individual compressors, in a process flow format, tracking rate of flow and pressure.
R. Scot Foss is president of Plant Air Technology, Charlotte, N.C., which specializes in air system auditing and design. This series of articles is based on his book, Compressed Air System Solution Series. To order a copy, click here.


